| TOC |
|
BIND 9 performance while
serving large zones under update
Copyright © 2008 Internet Systems Consortium, Inc. All Rights Reserved.
(A PDF version of this document is available at ftp://ftp.isc.org/isc/dns_perf/ISC-TN-2008-1.pdf
An HTML version that does not use frames is at http://ftp.isc.org/isc/dns_perf/ISC-TN-2008-1.html)
ISC has built a testbed out of Commercial Off-The-Shelf (COTS) servers that can perform full-scale tests of the performance of DNS protocols using real data from TLD and root servers, or synthetic data to test the performance of different mixes. We have been particularly interested in the performance of DNSSEC mechanisms within the DNS protocols and on the use of BIND as a production server for major zones.
High-end name service is typically provided by a battery of 13 servers, any one of which could be selected by the client that received the reply identifying them. Our testbed houses 13 servers and a framework that simulates an adequately-fast internet connection to them, so that our tests mirror as closely as possible the operating environment used by TLD and root name service operators. Test clients issue requests to the servers in the testbed, and outboard measurement systems track the requests and the responses.
We have measured raw query processing speed, DDNS update speed, and the speed of query processing while simultaneously updating via DDNS protocols. We used the COM zone from 5 October 2007 for these tests, and we used a 48-hour trace of the Palo Alto F-Root node as a source of query data.
This work was sponsored in part by the National Science Foundation via grant NSF OARC DNS SCI CISE SCI-0427144.
1. Introduction
2. Identifying appropriate server hardware
3. Operating system evaluations
4. Testbed physical construction
5. Test data stream
6. DNS Protocol performance measurements
7. Conclusions
Appendix A. Software availability
| TOC |
ISC has built a testbed that can perform full-scale tests of the performance of DNS protocols using real data from TLD and root servers, or synthetic data to test the performance of different mixes. We have been particularly interested in the performance of DNSSEC mechanisms within the DNS protocols and on the use of BIND as a production server for major zones.
Ordinary DNS traffic uses UDP datagrams. The protocol standard specifies that the replies be restricted to 512 bytes of payload (RFC1035, #4.2.1). In such a packet, the responding name server can fit 13 answers to a question. If the question asked is 'what are the name servers for domain example.com?', the answer will identify no more than 13 name servers. For this reason, high-end name service is typically provided by a battery of 13 servers, any one of which could be selected by the client that received the reply identifying them.
Our testbed houses 13 servers and a framework that simulates an adequately-fast internet connection to them, so that our tests mirror as closely as possible the operating environment used by TLD and root name service operators. Test clients issue requests to the servers in the testbed, and outboard measurement systems track the requests and the responses.
There probably exist enough supercomputers in the world for us to have built a cluster of 13 supercomputers that would have adequate performance under almost any conditions. But an important purpose of our testbed is to test with affordable commercial off-the-shelf server hardware. There is more value in testing the performance of servers that can be used around the world in DNS operations than in testing the performance of experimental servers that never leave a laboratory. So every component of our testbed has been moderately-priced COTS equipment that realistically can be used by full-scale name service operators.
Although we have tested with both signed and unsigned zones, we did not measure the performance of zone signing or re-signing as part of this project.
This work was sponsored in part by the National Science Foundation via grant NSF OARC DNS SCI CISE SCI-0427144.
The DNS Performance Testing Project was conceptually divided into these phases:
| TOC |
Our experience as authors and maintainers of BIND is that the performance of BIND is limited primarily by the processor and memory performance of the server computer, and by bottlenecks in the operating system. Vendors normally advertise processor speeds, but the performance of a computer's memory subsystem is not readily available. We have identified several candidate server computer configurations based on price and availability and have measured the memory performance (bandwidth, latency, and cache performance) of each.
We selected computers from various vendors that were priced such that we might be able to buy 16 of them for about $100K. We also included computers that we know were unacceptably slow, so that we could have a wider spectrum of results from the measurement suites. This included:
| ID | Vendor | Model | Code | Processor(s) | Memory | Bus | Comments |
| Sun 1 | Sun | Sun Fire | X4200 | 4x AMD254/2.8GHz | DDR-400 | PC3200 | |
| Sun 2 | Sun | Sun Fire | X4200 | 4x AMD285/2.6GHz | DDR-400 | PC3200 | |
| Iron 1 | Iron Systems | I-class | I1525HS | 2x Xeon/2.4GHz | DDR-400 | PC3200 | Intel E7505 chipset |
| Iron 2 | Iron Systems | M-class | MS3520HS | 4x AMD280/2.4GHz | DDR-400 | PC3200 | Tyan S3870 |
| Cel 1 | Celestica | A8440 | 2x AMD846/2.0GHz | DDR-333 | PC2700 | desktop | |
| DEC | Compaq | 1x Celeron/1.25GHz | SD-133 | PC133 | desktop | ||
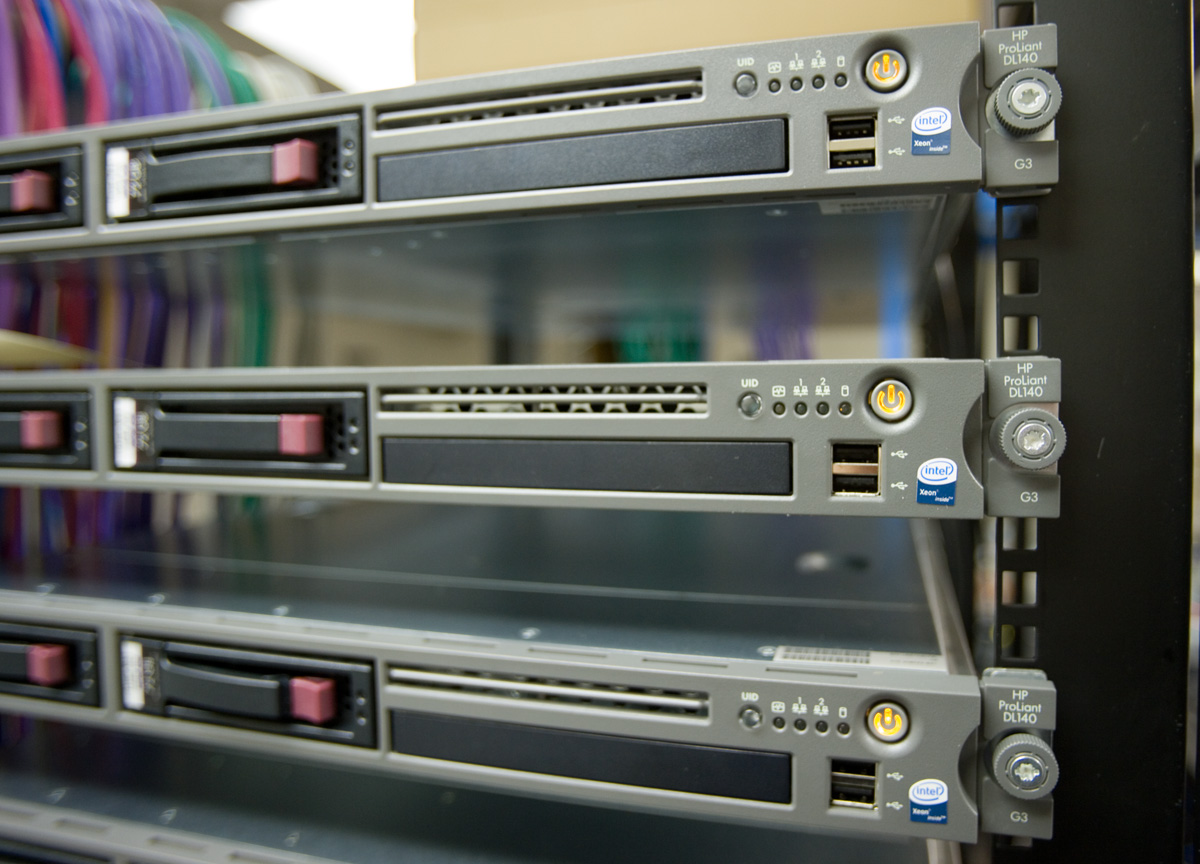
| HP 1 | Hewlett Packard | Proliant | DL 140g3 | 4x Xeon/3.0GHz | DDR2-667 | PC5400 | 1U system |
We measured a number of other less-powerful systems, primarily to help us be confident in our measurement methodology. None of them was a realistic candidate to be our server choice.
We began with the memtest86 measurement suite (v3.2), by means of a bootable CD that did not involve the subject computer's installed OS. This program claims to measure transfer rates in megabytes/sec to and from memory and caches. We followed with the calibrator (v0.9e), which measures cache and memory latency and TLB performance, and with lmbench (v3.0a4). Combined results are shown below, separated by CPU maker (Intel or AMD). We were suspicious of the memory bandwidth number for the HP 1 unit, presumably because the memtest86 program is not interfacing properly with its hardware. We investigated further using the STREAM system (v1.0), which shows bandwidth numbers similar to those from memtest86 for all units except HP 1.
AMD processors |
Intel processors |
|||||||
Sun 1 |
Sun 2 |
Iron 2 |
Cel 1 |
HP 1 |
Iron 1 |
DEC |
||
| Bandwidth in MBytes/sec | ||||||||
| L1 memtest86 | 22886 |
21251 |
19717 |
16331 |
49058 |
19607 |
12375 |
|
| L2 memtest86 | 5686 |
5280 |
4899 |
4230 |
-- |
14675 |
5610 |
|
| Memory mt86 | 2237 |
2202 |
2237 |
972 |
19559 |
1460 |
342 |
|
| lmbench | 2316 |
2368 |
1303 |
2984 |
2047 |
652 |
||
| Latency in nanoseconds (miss/replace) | ||||||||
| L1 calibrator | 3.48/3.47 |
3.73/3.73 |
4.08/4.07 |
5.07/5.05 |
3.07/3.80 |
6.82/6.94 |
4/4 |
|
| L2 calibrator | 99/99 |
98/98 |
116/116 |
165/165 |
64/104 |
114/116 |
102/102 |
|
| lmbench | 83 |
83 |
155 |
72 |
109 |
109 |
||
| STREAM benchmarks in MBytes/sec | ||||||||
| Copy | 1724 |
1816 |
1122 |
2586 |
1309 |
285 |
||
| Scale | 1785 |
1885 |
1175 |
2751 |
1194 |
310 |
||
| Add | 1896 |
1994 |
1254 |
2884 |
1329 |
394 |
||
| Triad | 1893 |
1958 |
1138 |
2890 |
1524 |
397 |
||
On the basis of these benchmarks, and of vendor prices, we selected the HP 1 system (DL 140g3) to use for our testbed. We began this benchmark assuming that AMD systems would be faster in our price range, but the data shows otherwise.
| TOC |
Having benchmarked the hardware for maximum performance in the kind of load to be offered, we now benchmark various operating systems for their suitability to run BIND 9. The same query stream is sent to the same version of the application software running on several different operating systems, and the processing speed is noted.
The testbed configuration is as follows:
Using several machines in our testbed (one for each OS), we are running an instance of these operating systems:
On each of the server test computers, we installed BIND 9.4.1-P1 and configured it to be authoritative for PT, COM.BR, and NL. We configured BIND to act as an authoritative server, with the following configuration:
options {
listen-on { 204.152.187.83; };
check-sibling no;
recursion no;
fetch-glue no;
allow-recursion { none; };
acache-enable yes;
max-acache-size 128M;
};
We began with some preliminary tests to determine whether or not the size of the zone file being served had an effect on server performance. We were not able to measure any difference in server response rates over a 50:1 ratio of zone file size. We believe that if we had used a zone file that was larger than the amount of physical memory on the server, there would have been significant performance degradation. After concluding that zone file size did not matter, we used the .PT zone for further testing because it was not tedious to copy it from machine to machine during server reconfiguration.
We used a 1-hour test data stream that was captured from queries to ns-ext.isc.org. We extracted those queries that enquired of the .PT zone. There were 1.13 million such queries in the test stream. We sent this query stream in turn to each of the test servers using the queryperf program. We measured the length of time that it took each server to answer all of the queries in this query stream, and from that determined the average query response rate at which the server breaks down and is no longer able to process further requests, for each operating system.
This table shows the approximate average number of queries per second processed by BIND 9.4.1-P1 running on the listed operating system using the testbed hardware in the configuration shown at the beginning of this page. The query rate shown is the 'breaking point' capacity such that the server would be forced to drop queries if it received them any faster (on average).
| Server capacity at breaking point | |
|---|---|
| OS | Queries/second |
| Linux Gentoo 2.6.20.7 | 93,000 |
| Linux Fedora Core 2.6.20.7 | 87,000 |
| FreeBSD-7-CURRENT 200708 | 84,000 |
| FreeBSD-6-stable 200708 | 55,000 |
| FreeBSD 6.2-RELEASE | 51,000 |
| Solaris-10 DevelExpr 5/07 | 50,000 |
| NetBSD-4.0-Beta 200708 | 42,000 |
| OpenBSD 4.1-snap-20070427 | 35,000 |
| Windows 2003 Server | 22,000 |
| Windows XP Pro64 5.2.3790 SP2 | 20,000 |
To determine whether or not there were performance differences in serving signed zones, we performed these tests using both signed and unsigned zone files. We did not test signed zones under all operating systems; we did this test using FreeBSD 6.2, making the assumption that relative speed differences would be the same across operating systems. Our test version of the unsigned zone file for .PT is 4.8 MB; the signed version of that file is 33.9 MB. In our test stream of 1.13 million queries we found no difference in the speed at which BIND 9.4.1-P1 responds to queries served from a signed version or unsigned version of the zone. There were differences in query size and total network traffic:
| Network byte count per test (entire 1.13 million queries) | ||
requests |
replies |
|
unsigned zone |
71.3 MB |
141.2 MB |
signed zone |
83.7 MB |
391.3 MB |
Average packet size in bytes
|
||
requests |
replies |
|
unsigned zone |
63 bytes |
125 bytes |
signed zone |
74 bytes |
346 bytes |
| TOC |
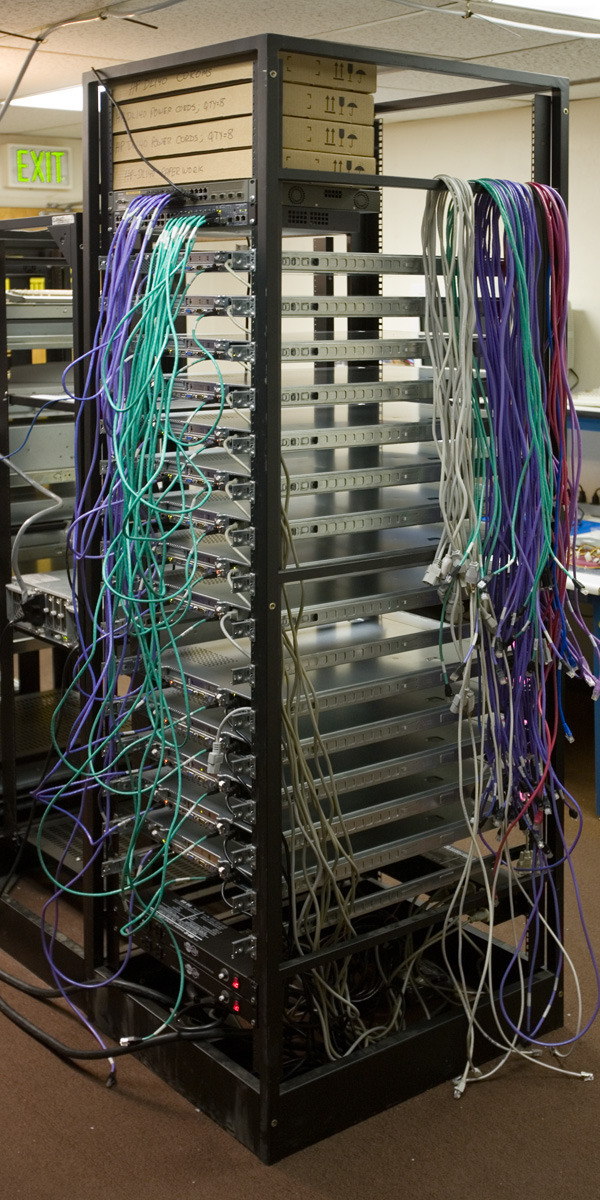
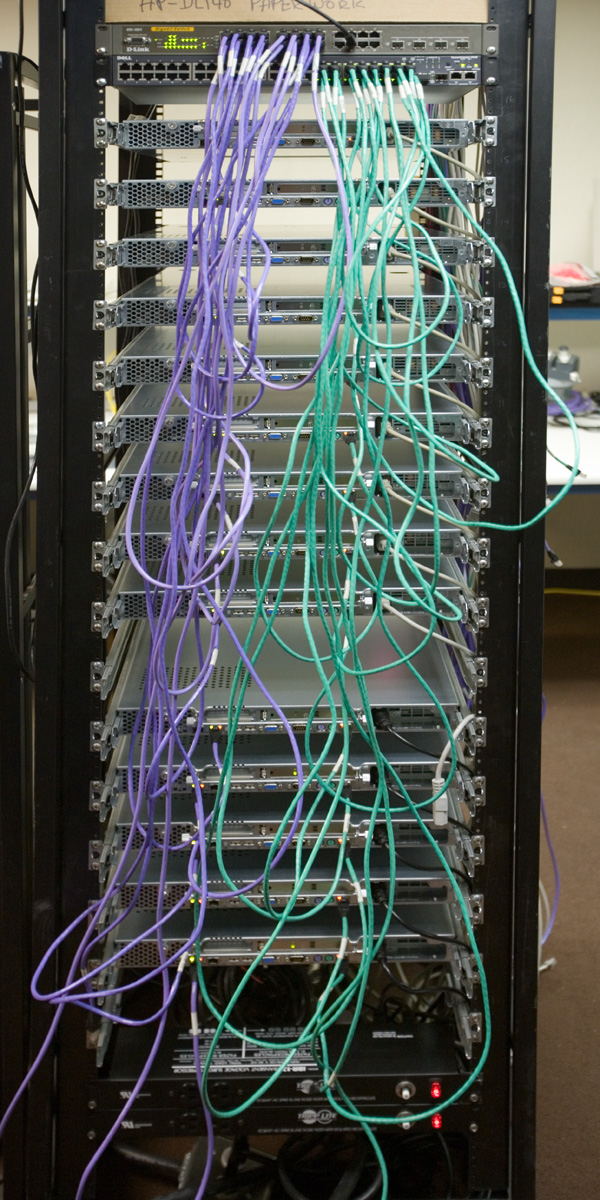
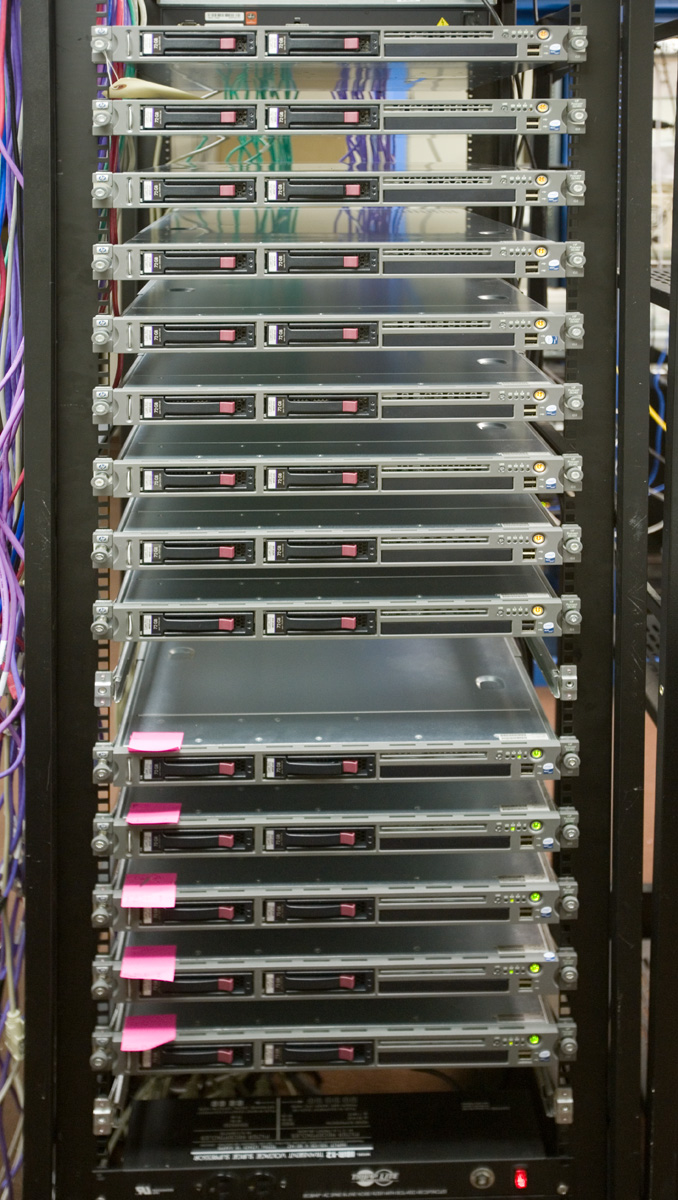
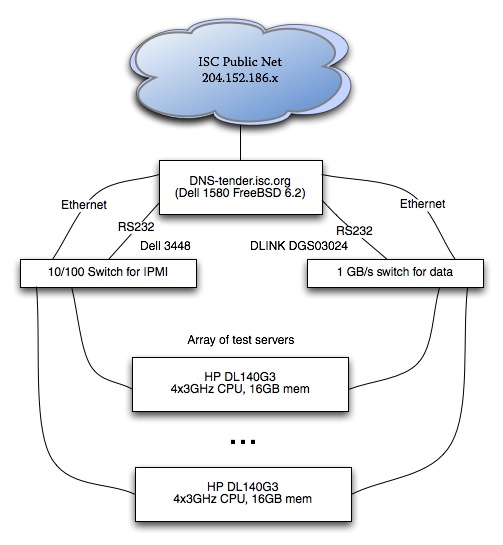
The logical design for ISC's DNS performance testbed is described in ISC technote TN-2006-2. The equipment fits in a single 7-foot 19-inch four-post rack, and requires 3 15-amp 120VAC power circuits. Because the engineers performing tests can be located anywhere in the world, we are using IPMI to administer and control the computers. This requires having a separate Ethernet to carry the IPMI signalling, requiring each server to have two Ethernet connections. Although IPMI was devised and popularized by Intel, several open-source IPMI clients are available.
We mounted the power controllers at the bottom of the rack and the Ethernet switches at the top of the rack. Because IPMI is a 10MBPS protocol, we used a (less expensive) 10/100 switch for the IPMI network, and a nonblocking Gigabit switch for the data transport network. The servers are mounted on slide rails, and use every second slot in the rack for better cooling.
Click on a photograph to pop up a larger view. These photographs were taken 4 April 2007.
|
|
||||
|
|
| TOC |
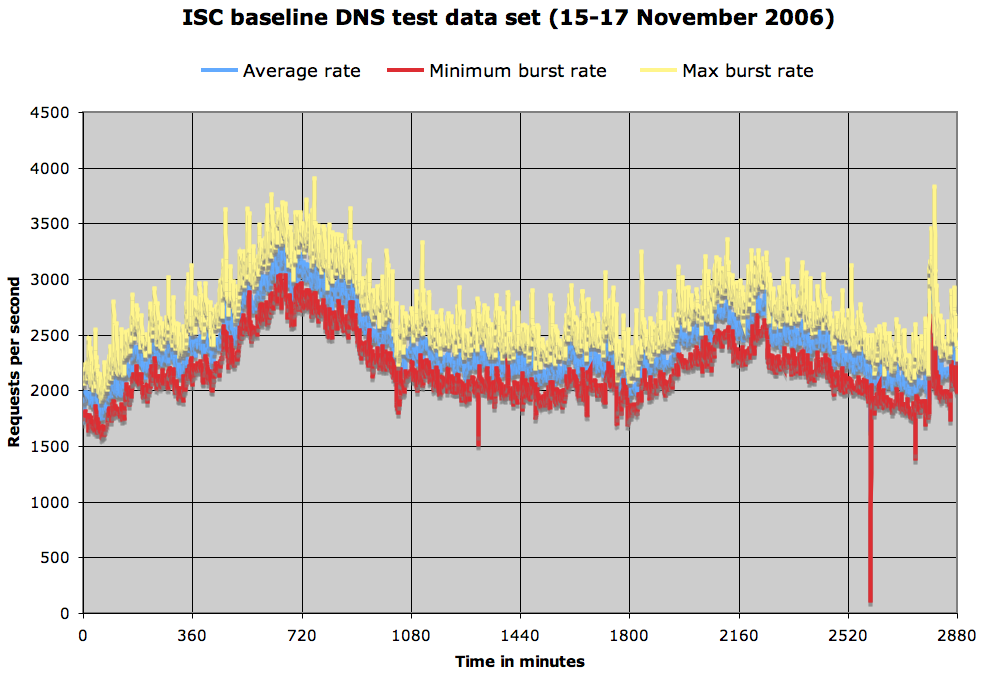
The purpose of this project is to test the performance of DNS servers under various conditions. This requires a baseline test stream, to which we will make various adjustments. A 48-hour baseline test stream was captured from the F-root server in Palo Alto on 15-17 November 2006.
We used tcpdump to capture all packets transmitted by the Palo Alto F-root server. UDP name service replies include the question to which they are the reply. The baseline tests will be run by reproducing the questions in this stream, one question per query packet. Other tests will require augmenting these queries with others (to increase the load) and replacing some of these queries with a different mix (to change the load without increasing it).
Below is the output from this characterization program run over the 15-17 November baseline stream.
Start: Wed, 15 Nov 2006 06:00:00 +0000, duration: 172800.00 seconds.
414931073 requests (38.8% failed)

Avg rate (requests/second) = 2401.2, 95%ile burst = 3011.0, Max burst = 3921.9
414342756 recursive queries (38.7% failed); 171887553 authoritative replies

23587274 TCP packets in 7906809 sessions (0 never closed) not analyzed (5.7% of total packets)

By type of query in default class:
  251892742/ 60.7%   A                          107157854 failed  (42.5%)
   41508116/ 10.0%   PTR                          6860091 failed  (16.5%)
   34088345/  8.2%   AAAA                         7343865 failed  (21.5%)
   23454402/  5.7%   SOA                         21453572 failed  (91.5%)
   23030654/  5.6%   MX                           6186641 failed  (26.9%)
   20844336/  5.0%   A6                            166356 failed   (0.8%)
    7440925/  1.8%   SRV                          7211917 failed  (96.9%)
    4729932/  1.1%   TXT                          1613960 failed  (34.1%)
    3715926/  0.9%   NS                            537492 failed  (14.5%)
    1902492/  0.5%   ANY                           860207 failed  (45.2%)
    1111659/  0.3%                                1111659 failed (100.0%)
    1020917/  0.2%   CNAME                         193925 failed  (19.0%)
      50697/  0.0%   NAPTR                          39748 failed  (78.4%)
      31239/  0.0%   TXT CHAOS                         50 failed   (0.2%)
      22763/  0.0%   MAILB                          22763 failed (100.0%)
      19929/  0.0%   A HS                           19929 failed (100.0%)
       6004/  0.0%   X25                             5917 failed  (98.6%)
       4225/  0.0%   Type0                            485 failed  (11.5%)
            (click here for the full chart, including the long tail)


Class ANY:
      34296/  0.0%                                   4451 failed  (13.0%)

Return codes (percentages are of total query count):
  159636174  38.5%  NXDomain
     529285   0.1%  FormErr
     504175   0.1%  update
      79421   0.0%  echo
      24769   0.0%  Refused
      22763   0.0%  NotImp
       2825   0.0%  notify
       1788   0.0%  stat
        178   0.0%  ServFail
         43   0.0%  server,
         32   0.0%  zoneInit
         21   0.0%  updataA
          8   0.0%  updateDA
          8   0.0%  zoneRef
          7   0.0%  inv_q
          7   0.0%  op6
          6   0.0%  op3
          5   0.0%  updateM
          1   0.0%  op7
          1   0.0%  updateD
          1   0.0%  updateMA
| TOC |
In earlier phases of this project we measured raw performance of proposed hardware platforms, and application performance of hardware/OS combinations. We used these measurements to select a test server system and we built a testbed using the selected systems as building blocks.
The ultimate purpose of all of this work is to measure the performance of the DNS protocols with the BIND software running on inexpensive commodity hardware. We spent time optimizing the speed of the server platform in order to ensure that we were getting the best possible results in our DNS protocol measurements.
In this section we describe the DNS protocol tests that we performed using our testbed and the results that we measured.
The test stream used is detailed in Section 5 of this report ("Test data stream"). The authoritative name servers were loaded with the COM zone as distributed by Verisign for 5 October 2007. Licensing restrictions prevent us from making that zone file public, but we can provide any suitably licensed research group with a copy of that file if Verisign no longer has a copy.
We wrote a program named "updgen", an update generator, which reads a zone file and produces from it an input file for the "nsupdate" program. Such input files must be created in the context of the zone file to which they are an update, in order to know the names of zones to be deleted and to make sure that added zones are not already there. During the testing various update streams were generated from various subsets of the COM zone. A tar file of the updgen program that generated them is at ftp://ftp.isc.org/isc/dns_perf/updgen.tar
The physical configuration of our testbed is described in ISC Technote ISC-TN-2006-2. There are additional test conditions that we have imposed in order to make the tests as realistic as possible. The logical and network configuration is described at the beginning of the "Operating system evaluations" section.
A production name server would never be run with a physical RAM size that would cause it to swap. It would be purchased with enough memory for the entire application to be resident. Budgetary constraints limited our servers to 16GB of RAM. For some tests that required us to divide the test zone into slices, each of which can fit into physical memory. The slicing technique is widely used by search engines for the same reason; swapping introduces unacceptable performance delays.
All computers in the testbed were loaded with identical copies of FreeBSD 7.0-RELEASE, and name server computers were running BIND 9.4.2. Test data was transmitted using the version of queryperf that was bundled in the BIND 9.4.2 release (see below under "Sending test data").
For queries-per-second measurements and DDNS update measurements we found that the COM zone could be divided into 2 pieces that did not cause swapping. For full-scale queries-while-updating measurements we found that the COM zone needed to be divided into 3 pieces.
The COM zone file that we used for these tests is 5.8 GBytes, unsigned. A signed version of that file is 15GBytes. Each unsigned half of the zone file is 2.9GBytes but causes BIND 9.4.2 to occupy 12.2GBytes of memory before answering any queries.
Query test streams were partitioned to match the slices of the zone file, using a simple awk command analogous to this one, which builds the subset of the queryperf file that corresponds to the 2nd slice of a 3-slice partition:
    cat com.queryperf | awk '
    {
        NAME=$1
        QTYPE=$2
        N=split(NAME,BurstNAME,"\.")
        Part2=tolower(BurstNAME[N-1])
        if ((Part2 <= "f") || (Part2 > "n")) {
            next;
        } else {
            print;
        }
    }
    ' > com.3part.g-n.queryperf
Server performance tests were executed by using the queryperf program (part of the BIND 9 distribution) on a machine dedicated to sending test data. We determined that a single queryperf process on this hardware base can send 46,000 queries per second under FreeBSD 7.0-RELEASE, and that if there are two queryperf processes running (either on one sender computer or two) that they can, combined, send 60,000 queries per second. Further addition of additional queryperf processes did not increase the test rate beyond 60,000 queries per second emitted from that server. In other words, a single load generator in our testbed cannot test at a rate faster than 60K queries per second in our configuration. We have two load generator computers and can if necessary use the "DNS Tender" as an additional source of load.
Note that in our testbed the load-sending computers have 4 CPU cores. When one queryperf process is sending at its maximum speed of 46,000 queries per second, the "top" system command indicates 5% idle time and a weighted CPU usage (WCPU) of 86%. With two queryperf processes running, idle time on the 4-processor system drops to 0.2% idle and the weighted CPU usage is 91%. Adding additional queryperf processes beyond these do not change the numbers from the 2-process measurements. This causes us to believe that this is an OS limit, but we did not investigate the reason for that limit.
Performance of zone signing and re-signing is not part of this study. Current trends (2008) are towards hardware accelerator cards and incremental re-signing. We measured neither, except incidentally, during which we noted that our hardware platform was able to sign the entire COM zone (the edition that we are using) in a bit more than 2 hours, and that the signed zone files are about 2.6 times bigger than the unsigned files.
To fit into the physical memory available on our test servers, the COM zone was divided into two slices, each containing half of the zone. We ran the tests using BIND 9.4.1-P1 on several different OS configurations, all using the same hardware with the same BIOS settings. Numbers are the number of queries per second that each server computer was able to process at maximum load, averaged over 5 runs with the same data.
COM 1st half |
COM 2nd half |
|
|---|---|---|
Linux-Fedora |
80872 |
76531 |
FreeBSD-7-RC1 |
75362 |
74993 |
Linux-Gentoo |
68881 |
71565 |
Solaris-10 edition of 8/07 |
64994 |
62915 |
Solaris-10 edition of 5/07 |
62248 |
59807 |
FreeBSD-6.2-Stable |
56461 |
55271 |
FreeBSD-6.2-Release |
53555 |
52700 |
NetBSD-4-current |
31670 |
32589 |
Since these measurements are per-server reply rates, the overal testbed is capable of responding to 1 million queries per second using our hardware and software configuration. At that rate it will consume about 4 Gbits/second of outbound network bandwidth, which means that the network speed would be the limiting factor of pure query speed for a production system built using this design.
The next measurement was to feed 10,000 DDNS update requests to the master server as fast as it would process them, measuring how long that took. We ran these tests using BIND 9.4.1-P1 on several different OS configurations, all using the same hardware with the same BIOS settings.
COM 1st half |
COM 2nd half |
|
|---|---|---|
FreeBSD-7-RC2 |
93.46 |
82.85 |
FreeBSD-6.2-Stable |
89.52 |
77.34 |
FreeBSD-6.2-Release |
471.70 |
446.23 |
NetBSD-4-Current |
80.32 |
81.77 |
Solaris-10 edition of 5/07 |
87.80 |
83.54 |
Solaris-10 eidtion of 8/07 |
63.21 |
64.10 |
Linux-Gentoo |
42.07 |
42.76 |
Linux-Fedora |
22.29 |
15.07 |
The anomalous behavior of FreeBSD-6.2-Release is, we believe, an error in the FreeBSD autoconfiguration mechanism that caused BIND to be compiled without the file-system commits (fsync) that are required by RFC2136. DNS updates are required to be committed to nonvolatile storage before the response is returned (RFC2136 section 3.5). The underlying hardware is not capable of that many committed file system writes per second, so the FreeBSD-6.2-Release tests could not have been committed to nonvolatile storage. We have no explanation for the anomalously slow performance under Linux-Fedora.
The final test was to combine the previous two, and measure the rate at which an authoritative server can respond to queries while simultaneously being updated via IXFR from a master host which is itself under continuous update at a controlled rate. As notedabove under "Test conditions", these tests were made with the COM zone divided into thirds.
We found that the test version of BIND that we were using (9.4.2) periodically paused to write safety copies of the updated zone information to stable storage. In our configuration that is not necessary because the production servers do not have the master copy of the zone information. We made a minor modification to BIND 9.4.2 so that it did not perform such writes, and with that modification in place, it ran nearly as fast when serving queries from a zone under constant update as it did when serving queries from a static zone. The modifications are available as a patch from ISC (contact info@isc.org) and will probably be included in a future version of BIND.
DNSSEC disabled |
DNSSEC enabled |
|
|---|---|---|
No updating |
69,400 |
61,200 |
Under update at 4 updates/sec |
67,600 |
60,100 |
Under update at 8 updates/sec |
68,100 |
58,500 |
Under update at 10 updates/sec |
67,400 |
58,000 |
Under update at 32 updates/sec |
60,900 |
54,900 |
| TOC |
These results are encouraging, because they show that open-source software and commodity hardware are up to the task of providing full-scale production name service on the largest zones in existence. There are several obvious conclusions that can be drawn from them.
Our testbed is available to qualified DNS and protocol researchers who wish to repeat our experiments or run other experiments; contact info@isc.org to make arrangements.
| TOC |
Very little custom software was necessary for this project. There are two packages developed for it:
Our compilation and coding work was done on a FreeBSD 6.2 system, and these two packages are known to compile on FreeBSD 6 and 7 systems.
| TOC |
| Brian Reid | |
| Internet Systems Consortium, Inc. | |
| 950 Charter Street | |
| Redwood City, CA 94063 | |
| US | |
| Phone: | +1 650 423-1327 |
| EMail: | Brian_Reid@isc.org |